ログファイル
概要: ドメインログブラウザは、ウェブサーバのログを解析し、関連する警告とエラーメッセージを Plesk インターフェースに表示するため、ウェブサイトで発生している問題のトラブルシューティングに役立ちます。
In this topic, you will learn how to view the contents of log files for any given domain in Plesk. You will also learn how to add custom log files to the list of logs monitored by Plesk.
概要
Linux の場合、デフォルトで以下のログファイルからの情報が表示されます。
- Apache アクセス(access_log): このログには、Apache ウェブサーバによって処理されたすべての HTTP 要求が記録されます。
- Apache SSL アクセス(access_ssl_log): このログには、Apache ウェブサーバによって処理されたすべての HTTPS 要求が記録されます。
- Apache エラー(error_log): このログには、診断情報が記録されます。また、要求の処理中に Apache ウェブサーバに発生したエラーもすべて記録されます。
- nginx アクセス(proxy_access_log): このログには、nginx プロキシウェブサーバによって処理されたすべての HTTP 要求が記録されます。
- nginx ssl アクセス(proxy_access_ssl_log): このログには、nginx プロキシウェブサーバによって処理されたすべての HTTPS 要求が記録されます。
- nginx エラー(proxy_error_log): このログには、診断情報が記録されます。また、要求の処理中に nginx プロキシウェブサーバに発生したすべてのエラーが記録されます。
Windows の場合、IIS ログからの情報が表示されます。このログは、ウェブサーバによって処理されたすべての HTTP 要求および HTTPS 要求と、要求の処理中にウェブサーバで発生したすべてのエラーを記録するものです。
これに加え、ウェブサイトディレクトリから任意のカスタムログファイルを追加して、以下のようにドメインログブラウザで追跡することができます。
ドメインログブラウザへのアクセス
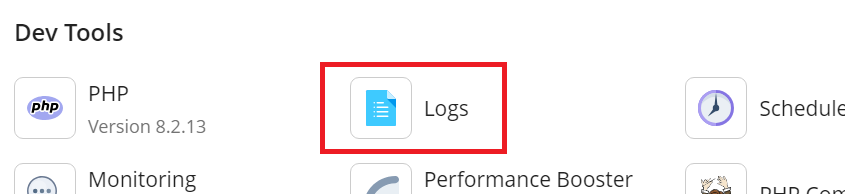
To access the domain log browser, go to Websites and Domains, find the domain whose logs you want to see, and then click Logs (under "Dev Tools").
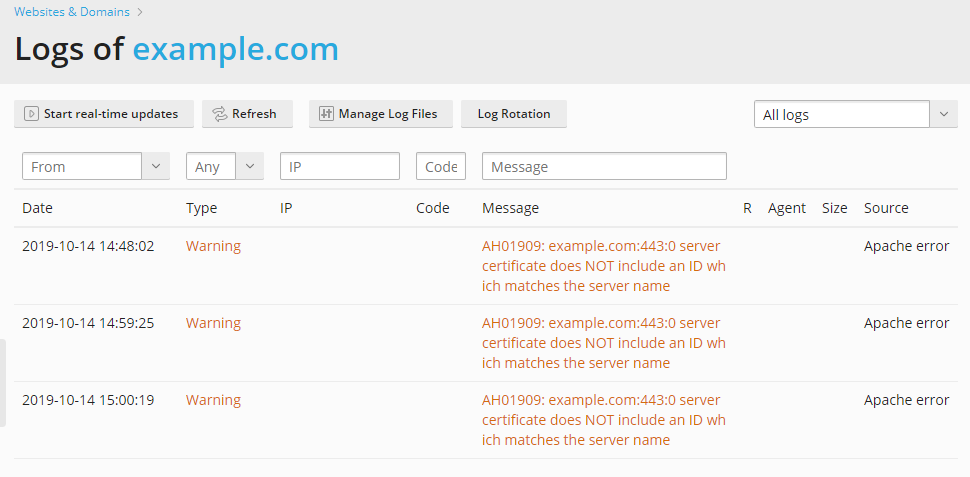
ログから収集されたメッセージのリストが表示されます。デフォルトで、ドメインログブラウザには、開いた時点で監視中のログに記録されていたメッセージが表示されます。リストを更新して、ドメインログブラウザを開いた後で追加されたメッセージも表示するには、[更新]をクリックします。あるいは、新しいメッセージがリストに逐次追加されるようにするには、[リアルタイム更新を開始]をクリックします。
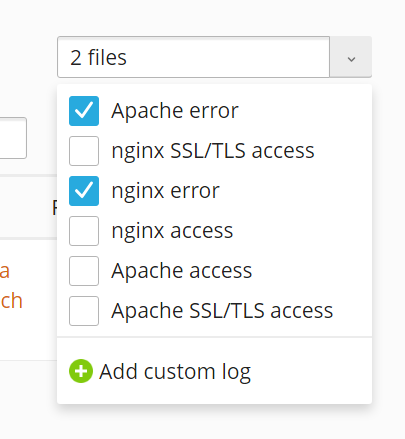
To select the logs from which you want to view messages, click this button
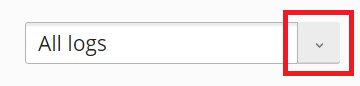
and then select the desired logs from the menu.
ログファイル管理
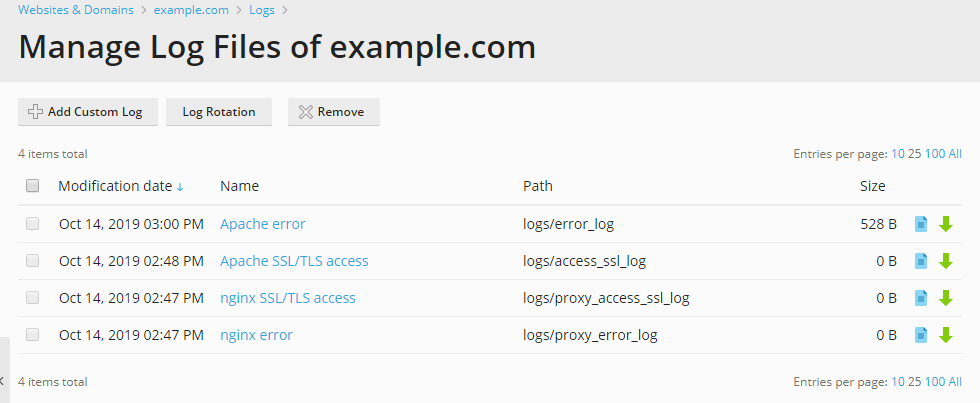
To view all the messages in a log, go to Websites and Domains, find the domain whose logs you want to see, click Logs, and then click Manage Log Files. The list of all tracked log files will be displayed.
ここでログファイル名をクリックすると、そのファイルの内容がドメインログブラウザに直接表示されます。ログファイルの横の ![]() アイコンをクリックするとログが別ウィンドウに表示され、
アイコンをクリックするとログが別ウィンドウに表示され、![]() アイコンをクリックするとログがダウンロードされます。
アイコンをクリックするとログがダウンロードされます。
To save disk space, you can enable log rotation - that is, automatic compression and/or deletion of outdated website log files. To set up log rotation, go to Websites and Domains, find the domain whose logs you want to rotate, click Logs, and then click Log Rotation.
ローテーション後にログファイルを削除することもできます(ローテーションされていないログファイルは削除できません)。
カスタムログファイルの追加
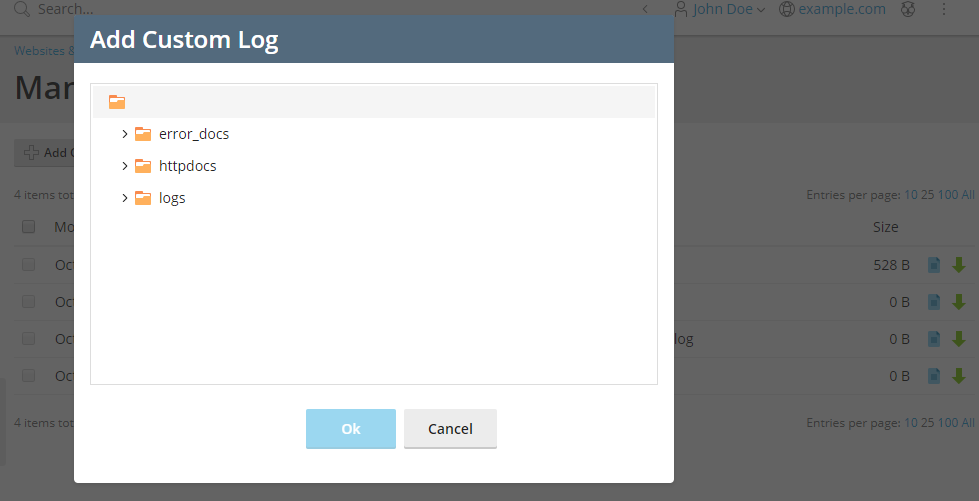
You can add any custom log file from your web site directory to track its changes in the domain log browser. To do this, go to Websites and Domains, find the domain you want to add a custom log for, click Logs, click Manage Log Files, and then click Add Custom Log. The tree with your web site folders will be displayed. Select the file that you want to add to the domain log browser and click OK.
注釈: 選択できるのは、平文テキストファイルのみです。適切に表示するためには、カスタムログファイルの各ログエントリにタイムスタンプが必要です。タイムスタンプがなければ正しく解析できません。
これで、選択したログファイルが、管理対象のログファイルのリストに表示されるようになります。
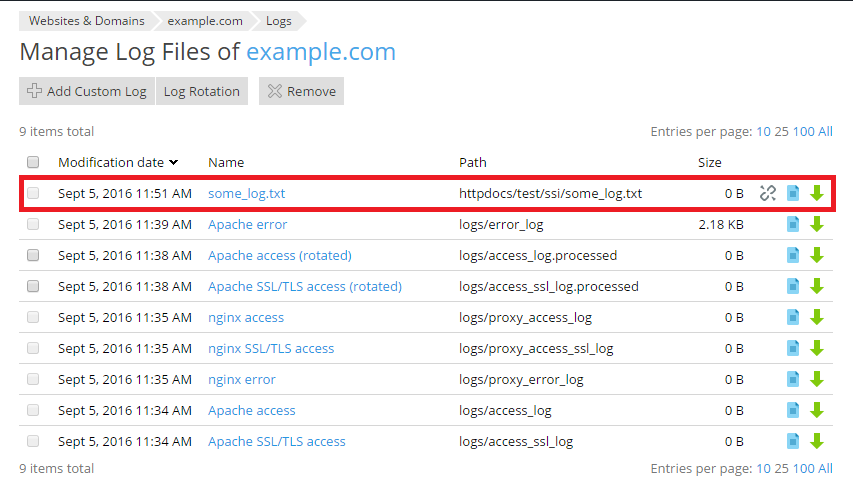
このカスタムログファイルを監視する必要がなくなった場合は、横の  アイコンをクリックします。これにより、このファイルがドメインログブラウザのファイルリストに表示されなくなりますが、ファイルシステムから削除される訳ではありません。
また、ファイルマネージャの[ログブラウザで開く]オプションを使用して、ファイルマネージャからドメインログブラウザでテキストファイルを直接開くこともできます。
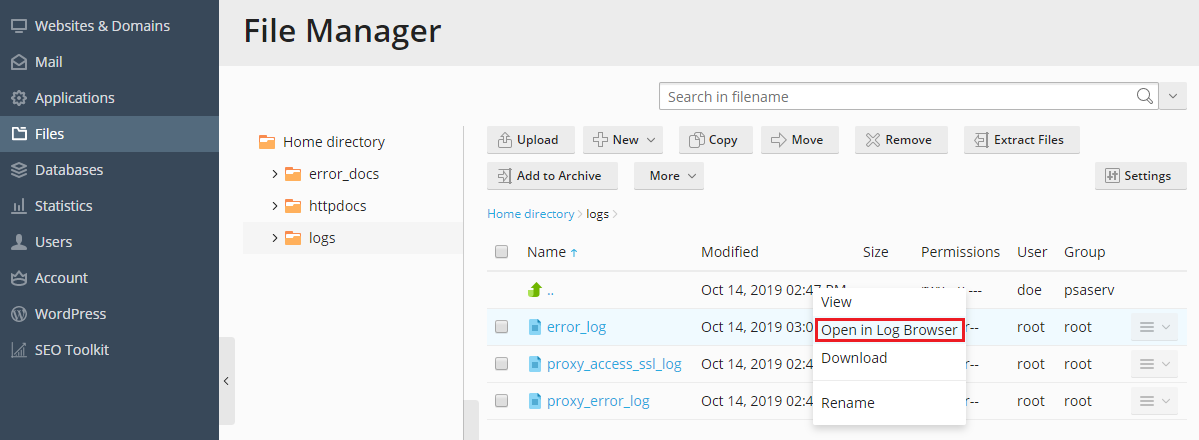
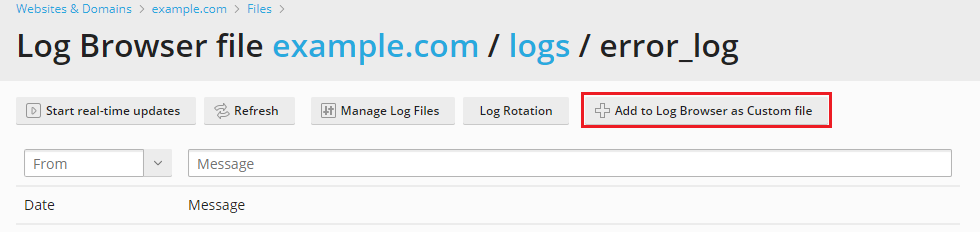
ファイルマネージャからドメインログブラウザでログファイルを開いても、その段階ではまだ、ドメインログブラウザに表示されるログのリストに永久的に追加された訳ではありません。ファイルをドメインログブラウザに追加するには、[カスタムファイルとしてログブラウザに追加]ボタンをクリックします。
注釈: カスタムログファイルに対してログローテーションを実行することはできません。