Viewing Statistics
To view the information on usage of server resources:
-
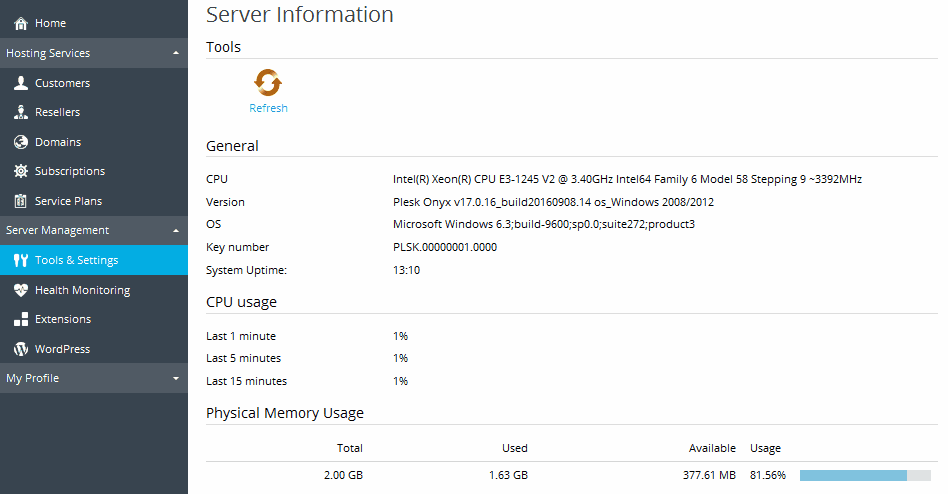
Go to Tools & Settings > Server Information.
The following information will be presented:
- Processor information.
- Plesk version and build number.
- Operating system and its kernel version.
- Plesk license key number.
- Server uptime.
- Processor load averages for the last 1 minute, 5 minutes and 15 minutes.
- The amount of RAM installed and used.
- The amount of swap space used.
- Hard disk usage by partitions and directories.
- The connected (mounted) storage and network storage devices.
- The number of hosted domains: active shows the domains that are online; problem shows the domains that have exceeded the disk space and bandwidth allotments but still online; passive shows the domains that are offline because they were suspended by you or your resellers.
-
Click Refresh to update the server statistics with the latest data.
To view a report on resource usage by your resellers, customers, and websites:
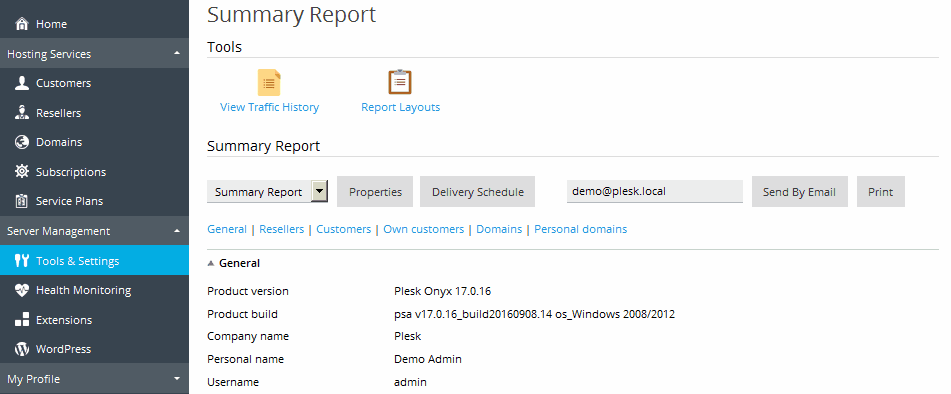
- Go to Tools & Settings > Summary Report.
- To view a summary on bandwidth usage by months, click View Traffic History.
Operations on reports:
-
To get more details, select the Full Report option from the drop-down menu.
-
To adjust the amount of information presented in a report, edit an existing report template or create a new one. To edit a template, click Properties, and then modify the report template.
To create a template, go to Report Layouts > Create Report Layout, and specify how much information you want in each section of the report: select None if you do not want any information, select Summary if you want a concise overview, or select Full, if you need a detailed report. Select the Use as default report checkbox and click OK.
To delete a custom report layout, select the checkbox corresponding to the report layout name and click Remove.
-
To print the report, click Print. A report will open in a separate browser window. Select the File > Print option from the browser’s menu to print the report.
-
To send the report by email, click Send by Email. By default, the administrator’s email address is used, but you can type in a different one in the corresponding field.
-
To have the reports automatically generated and delivered by email on a daily, weekly, or monthly basis, click Delivery Schedule and follow the instructions supplied in the section Automating Report Generation and Delivery by Email.
To view a report on traffic usage by users and sites:
-
Click Tools & Settings.
-
Do any of the following:
-
To view reports on the amount of traffic used by resellers, click Traffic Usage By Resellers (in the Statistics group).
-
To view reports on the amount of traffic used by customers, click Traffic Usage By Customers (in the Statistics group).
-
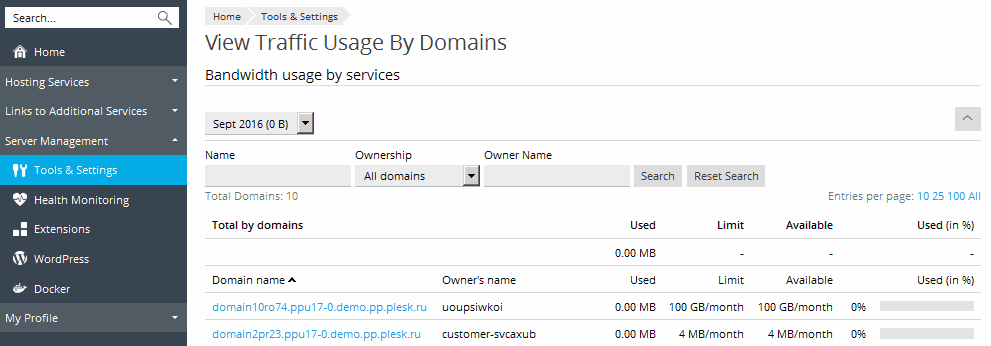
To view reports on the amount of traffic used by domains (websites), click Traffic Usage By Domains (in the Statistics group).
-


