Viewing Statistics
summary
To better understand how server resources are used, you can access a variety of server information and statistical data (such as memory or traffic usage) right from the Plesk interface.
Learning about the current server resources’ usage
To learn about current CPU, RAM, swap, and disk space usage, visit the “Info and Statistics” page. There, you can also see the number of domains hosted on the server that are “active” (domains that are online), “problems” (domains that are online, but have exceeded their disk space and/or bandwidth limits), and “inactive” (domains that are offline due to being suspended).
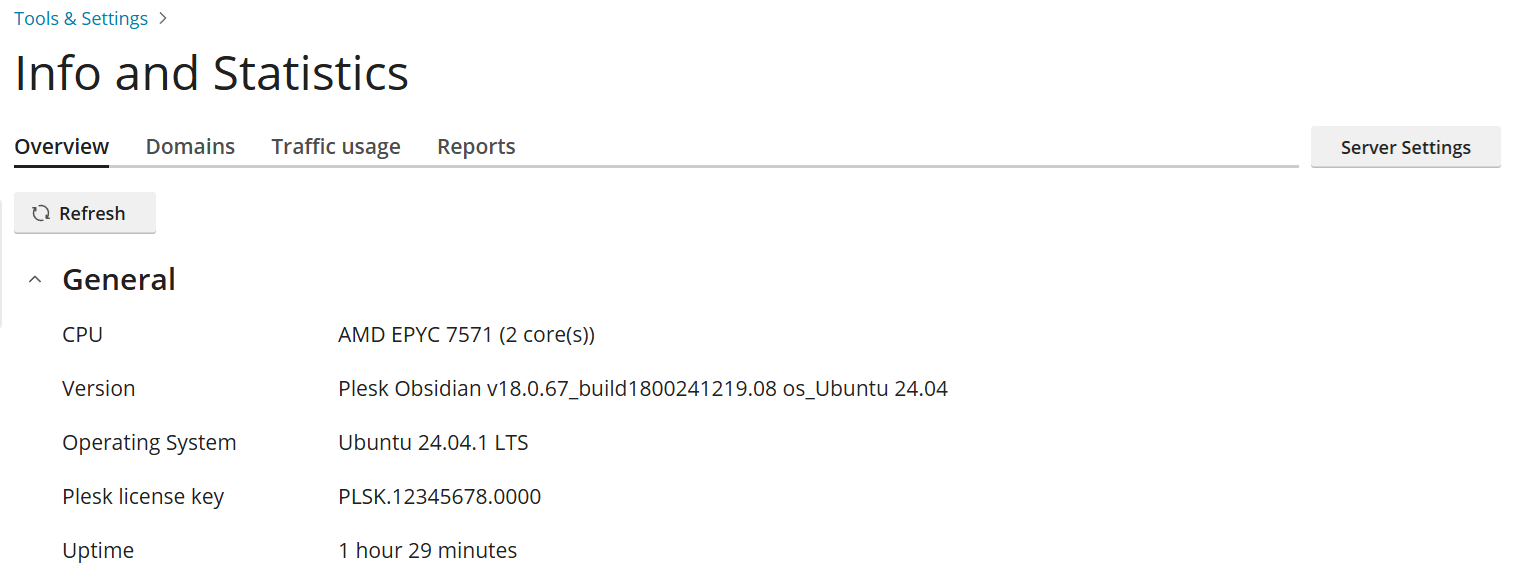
To learn about the current server resource usage:
Go to Tools & Settings > Info and Statistics (under “Server Management”).
-
(Optional) Click Refresh to load the most up-to-date information.
Note
Up-to-date information is loaded every time you open this page. Clicking Refresh is only useful if the page has been open for a while, or if you are closely monitoring server resource usage.
Learning about disk space and traffic usage
To learn the number of resellers and customers on the server (both active and inactive), and also how much disk space and traffic is used in total by all domains hosted on the server, visit the “Reports” tab on the “Info and Statistics” page.
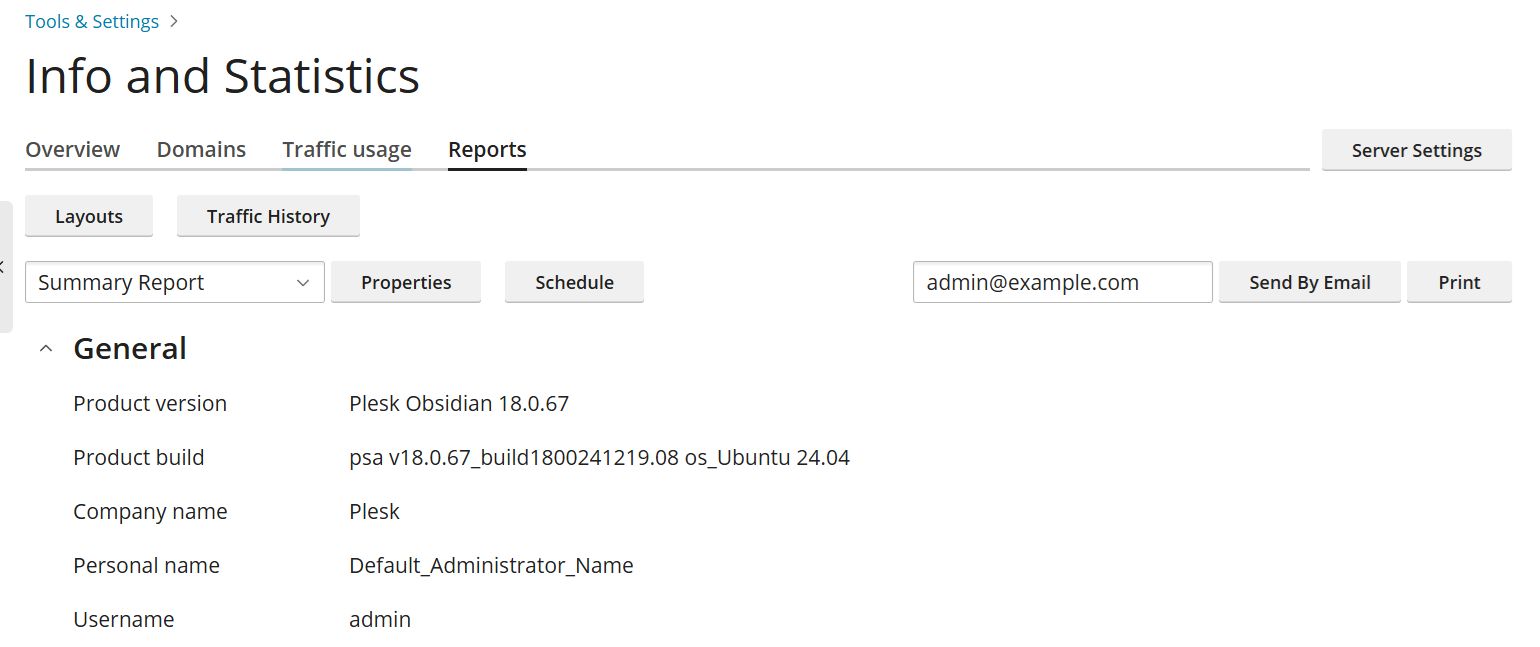
To learn about disk space and traffic usage:
Go to Tools & Settings > Info and Statistics (under “Server Management”).
Go to the “Reports” tab.
(Optional) To see a different report, select the desired report template from the drop-down menu.
Reports are generated from templates, which determine the level of detail in a report. By default, two reports templates are available, “Summary” and “Full”. You can create, remove, and customize report templates.
To customize a report template:
Go to Tools & Settings > Info and Statistics (under “Server Management”).
Go to the “Reports” tab, and then select the report you want to customize from the drop-down menu.
Click Properties, make the desired changes, and then click Save.
To create a report template:
Go to Tools & Settings > Info and Statistics (under “Server Management”).
Go to the “Reports” tab, click Layouts, and then click the
 icon.
icon.Name and customize the report template, and then click Save.
To remove a report template:
Go to Tools & Settings > Info and Statistics (under “Server Management”).
Go to the “Reports” tab, and then click Layouts.
Select the checkbox next to the report template you want to remove, click Remove, and then click Yes, remove.
For your reference, you can print a report out or send it via email. You can also set up automatic delivery of reports.
To print a report:
Go to Tools & Settings > Info and Statistics (under “Server Management”).
Go to the “Reports” tab.
(Optional) To print a different report, select the desired report template from the drop-down menu.
Click Print. The report formatted for printing will open in a separate browser window.
Select the File > Print option from your browser’s menu to print the report.
To send a report by email:
Go to Tools & Settings > Info and Statistics (under “Server Management”).
Go to the “Reports” tab.
(Optional) To send a different report, select the desired report template from the drop-down menu.
(Optional) Enter the desired email address. By default, the administrator’s email address is used.
Click Send By Email.
To have reports automatically generated and delivered by email:
Go to Tools & Settings > Info and Statistics (under “Server Management”).
Go to the “Reports” tab.
(Optional) To regularly receive a different report by email, select the desired report template from the drop-down menu.
Click Schedule, and then click Add Schedule.
Select the “Enable” checkbox.
Under “Deliver frequency”, select whether to receive the report daily, weekly, or monthly.
Under “Deliver to”, enter the desired email address. By default, the administrator’s email address is used.
On this page, you can also see how much traffic was used on the server during any particular month.
To learn about traffic usage for a particular month:
Go to Tools & Settings > Info and Statistics (under “Server Management”).
Go to the “Traffic usage” tab, and then select the desired month from the drop-down menu.
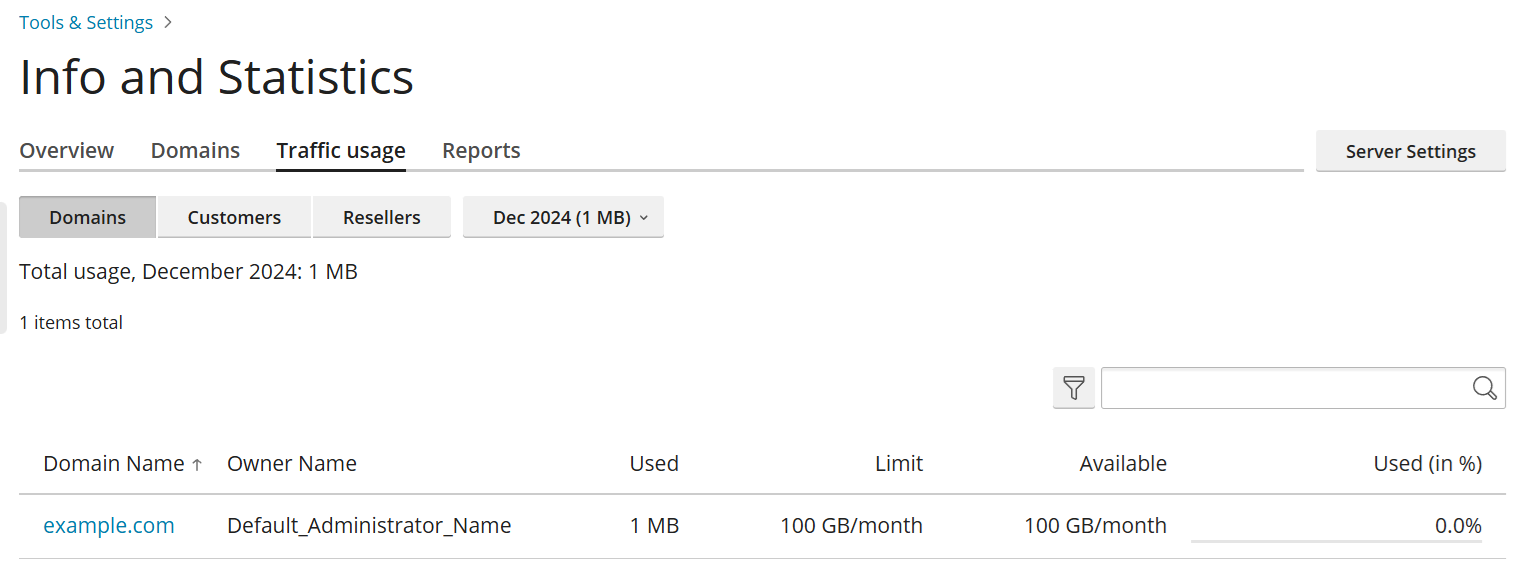
Learning about traffic usage by domains, customers, and resellers
To learn how much traffic was used by a particular domain, customer, or reseller during a particular month, visit the “Traffic usage” tab on the “Info and Statistics” page.
To learn about traffic usage by domains, customers, or resellers:
Go to Tools & Settings > Info and Statistics (under “Server Management”).
Go to the “Traffic usage” tab, and then select the desired month from the drop-down menu.
-
To see traffic usage broken down by individual customers, click Customers. For resellers, click Resellers.