Monitoring System and Mail Server Logs
summary: Troubleshooting issues with various Plesk services can be made easier by studying the information found in those services’ log files. The Log Browser extension assists you by making it easy to see and search through logs of many different services via a single interface.
Note that while the extension makes it easier to access information useful for troubleshooting, it cannot fix issues automatically or provide additional assistance in troubleshooting an issue. If you are experiencing an issue and are not comfortable fixing it hands-on, use the plesk repair utility or contact support.
Log Browser is a free extension, and can only be used by the Plesk administrator. The extension is only available in Plesk for Linux.
Prerequisites
The extension is included in the “Recommended” preset and is likely already installed in your Plesk. If not, install the extension from the Extensions Catalog.
When the extension is installed, you can see the Log Browser icon in Extensions > My Extensions.
Troubleshooting Issues Using Log Browser
With Log Browser, you can troubleshoot issues related to mail, and also to many other Plesk services (by manually configuring the source(s) of log entries to see).
Troubleshooting an issue with mail:
-
Go to Tools & Settings, and then click Log Browser (under “Assistance and Troubleshooting”).
-
Go to the “Mail” tab.
-
The next step differs depending on whether you are troubleshooting an issue that took place in the past or one that can be reliably reproduced:
- If the issue took place in the past, click the “Select date” field and specify the date and time the issue took place. You will only see log entries from that date/time onwards. The more accurately you do this, the less log entries you will need to sift through.
- If the issue can be reliably reproduced, instead click the Real-time update toggle button so that it shows “Enabled”, and then click Clear. Reproducing the issue should fill the list with the relevant log entries.
-
Click the
 icon to configure the filter.
 -
Under “Priority”, configure what kinds of messages you want to see. Priority levels range from 0 (“Emergency”, highest) to 7 (“Debug”, lowest). You can select multiple priority levels at once, but must select at least one.
Note: When troubleshooting an issue, messages with a priority level lower than four (“Warning”) are more likely to distract than to help. However, if troubleshooting the issue proves difficult, we recommend adding messages with priority level seven (“Debug”) to the list.
-
(Optional) Under “Source”, select one or more services to only see log entries related to those services. By default, messages related to all mail services are shown.
-
Click the
icon once again to close the filter.
You should now see all log entries for the specified services created during the specified time frame.
Troubleshooting an issue with a different service:
-
Go to Tools & Settings, and then click Log Browser (under “Assistance and Troubleshooting”).
-
Go to the “System” tab.
-
The next step differs depending on whether you are troubleshooting an issue that took place in the past or one that can be reliably reproduced:
- If the issue took place in the past, click the “Select date” field and specify the date and time the issue took place. You will only see log entries from that date/time onwards. The more accurately you do this, the less log entries you will need to sift through.
- If the issue can be reliably reproduced, instead click the Real-time update toggle button so that it shows “Enabled”, and then click Clear. Reproducing the issue should fill the list with the relevant log entries.
-
Click the
icon to configure the filter. -
Under “Priority”, configure what kinds of messages you want to see. Priority levels range from 0 (“Emergency”, highest) to 7 (“Debug”, lowest). You can select multiple priority levels at once, but must select at least one.
Note: When troubleshooting an issue, messages with a priority level lower than four (“Warning”) are more likely to distract than to help. However, if troubleshooting the issue proves difficult, we recommend adding messages with priority level seven (“Debug”) to the list.
-
(Optional) Select the source of the messages to see. By default, all messages that meet the date/time and priority level criteria are shown. You can narrow the list down by specifying the source of the desired messages:
- To see messages from one or more broad categories (for example, “Mail system” or “FTP daemon”), select them under “Facility”.
- To see messages from one or more specific services (for example, “nginx” or “dovecot”), select them under “Source”.
Note: Only use either “Facility” or “Source”, never both. Selecting incompatible “Facility” and “Source” combinations (for example, “Mail system” and “nginx”) will result in an empty filter.
-
Click the
icon once again to close the filter.
You should now see all log entries for the specified services created during the specified time frame.
Searching for Mail Log Entries
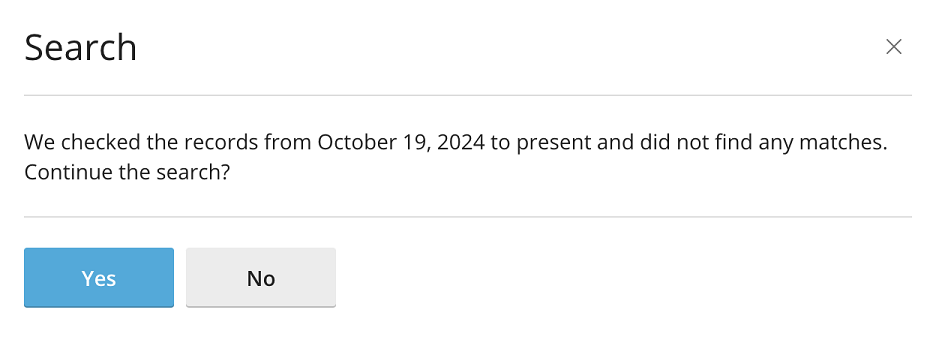
By default, when you search for log entries on the Mail tab, the log entries for the last 30 days are searched. If no entries are found, Log Browser suggests that you extend the search (see the screenshot below). Every time you extend the search, the log entries for 30 more days are searched. So, if you click Yes, the log entries for the last 60 days will be searched. If you extend the search once again, the log entries for the last 90 days will be searched, and so on.
You can also specify the date to start the search from using the calendar in the top left corner of the screen. After selecting the starting date from the calendar (for example, October 1st), the log entries for the selected date plus the next 30 days will be searched (in this example, October 1st to October 31st). Every time you continue the search, the log entries for the next 30 days are searched (in this example, November 1st to November 30th), and so on.
You can change the default value of 30 days by editing the panel.ini file.
To change the default value of the search time frame on the Log Browser Mail tab:
-
Open the panel.ini file for editing, which is located here:
- (Plesk for Linux)
/usr/local/psa/admin/conf/panel.ini - (Plesk for Windows)
%plesk_dir%admin\conf\panel.ini
You can also edit the file in the Plesk interface using the Panel.ini Editor extension.
- (Plesk for Linux)
-
Add lines of the following pattern to the
panel.inifile, and then save it:[ext-log-browser] mail.SearchTimePeriod = <number of time units><time unit>
For example, to change the search time frame to two weeks, add the following lines:
[ext-log-browser]
mail.SearchTimePeriod = 2week
The mail.SearchTimePeriod setting takes time values that can be suffixed with the following units: year, month, week, day, hour, min. For example, 2month or 2month 1day. You can also specify a value in seconds without any suffix, for example, 5184000 (60 days in seconds).